- Published on
Restaurant Quality App
- Authors

- Name
- Vincent Hu
Introduction
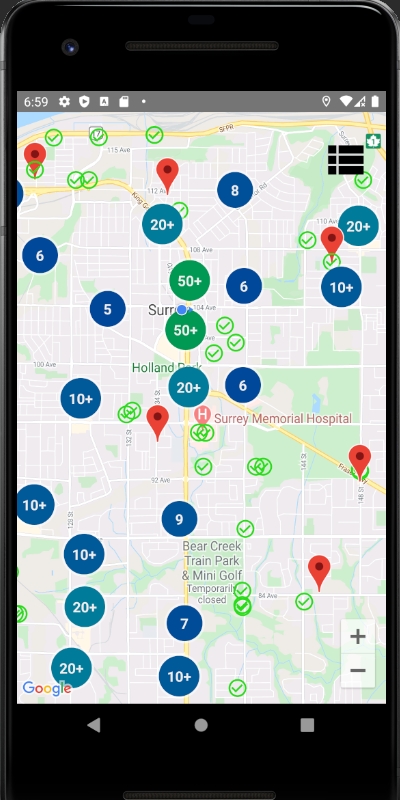
The app uses data from BC Health to show the quality of a restaurant in Surrey, Vancouver. The app was made by Java, integreted with Google Map and PostgreSQL.
Features
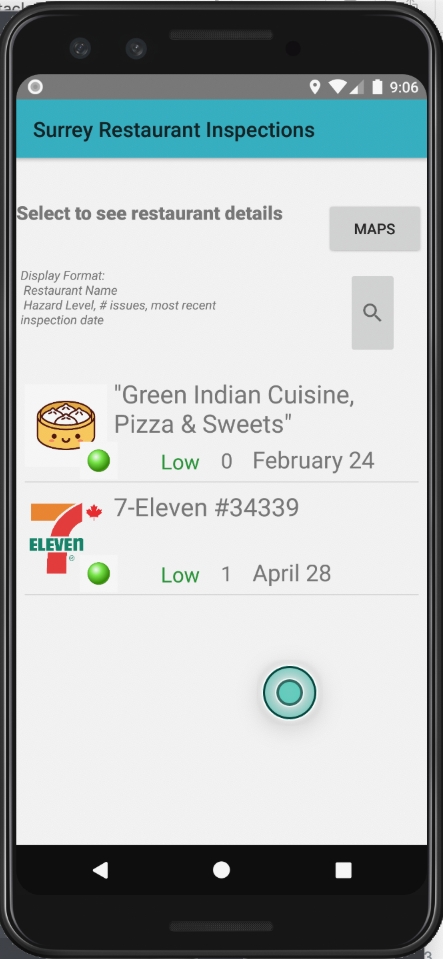
1. Display List of All Restaurants
a. Live Update Data
- The app comes with live update data of restaurants and inspection report data for Surrey, Vancouver.
b. Alphabetical Sorting
- Displays a list of all restaurants sorted alphabetically.
c. Restaurant Information
- Each restaurant in the list includes:
- Restaurant Name: Displayed prominently.
- Restaurant Icon: Visual identifier for the restaurant.
- Recent Inspection Info:
- # of Issues Found: Sum of critical and non-critical issues.
- Hazard Level:
- Colour-coded (low, medium, high).
- Includes a hazard level icon.
- Time of Last Inspection:
- Intelligent date formatting:
- Within 30 days: Show number of days ago (e.g., "24 days").
- Within a year: Show month and day (e.g., "May 12").
- Over a year ago: Show month and year (e.g., "May 2018").
- Intelligent date formatting:
d. Clickable List
- Users can click on a restaurant in the list to view detailed information (see 2. Display Details of Single Restaurant).
2. Display Details of Single Restaurant
a. Overview Screen
- Provides detailed information about a single restaurant, including its inspection history.
b. Restaurant Details
- Restaurant Name
- Restaurant Address
- GPS Coordinates
c. Inspection History
- Displays a scrollable list of all inspections for the restaurant, with the most recent inspection at the top.
- Each inspection entry includes:
- # of Critical Issues Found
- # of Non-Critical Issues Found
- Time Since Inspection: Uses the same intelligent formatting as above.
- Hazard Level:
- Colour-coded.
- Includes an icon for visual clarity.

a. Inspection Details Screen
- Provides a detailed view of a single inspection report.
b. Inspection Details
- Full Date of Inspection: (e.g., "May 12, 2019").
- Inspection Type: Routine or follow-up.
- # of Critical Issues Found
- # of Non-Critical Issues Found
- Hazard Level:
- Icon representing the hazard level.
- Hazard level in words.
- Colour-coded indicator.
c. Violations List
- Scrollable list of violations, each showing:
- Violation Icon: Reflects the type of violation (e.g., food, pest, equipment, etc.).
- Brief Description: Fits on a single line.
- Severity Indicator: Highlighted with red colours for severe violations.
d. Violation Details
- Users can tap on a violation to view its full description.
Team Members
A big appreciation to my teammates.
- Jimmy (qhbui@sfu.ca)
- Kabir (snooh@sfu.ca)
- Simon (simon_eaton@sfu.ca)
- Vincent (jiaqingh@sfu.ca)